


Creating a product roadmap is a balancing act for product owners, an effort to reconcile two conflicting facts. The first fact is that product development is inherently unpredictable and emergent. Agile approaches were created to directly address this fact, with the values in the Agile Manifesto clearly pointing towards a preference for learning as we build. Scrum’s inspect and adapt cycles are intended to give us regular control points where we can modify our plans to benefit from what we’re learning as we develop the product.
The second fact is that our organizations crave certainty and predictability. This fact stems from two sources. First, leaders want to know that investments and budgets are likely to lead to good outcomes. Second, product development is part of a larger ecosystem including efforts like marketing, sales, and in the case of physical products, packaging, supply chains, and retail channel partners. There is a real need to coordinate efforts across those various components.
Effectively balancing those conflicting facts requires a product owner to break from the most common format for product roadmaps – a set of date-based columns containing bulleted lists of features to be completed by those dates.
Standard product roadmap format
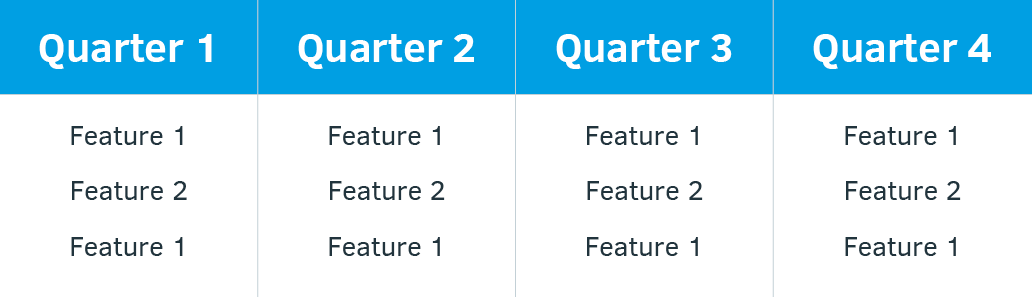
This typical format is a “worst of both worlds” approach. It provides too much detail too far into the future at the feature level, while providing too little detail about what factors the product owner is using to guide prioritization and timing. We can break this conflict by using a different format for our product roadmaps, one that provides details appropriate for the time horizon, and adds different lanes for other important factors that will impact prioritization and timing.
In this article we’ll share three tools to improve your ability as a product owner to better balance the two conflicting facts of emergence and forecasting certainty. The initial ideas behind this pattern originate from Luke Hohmann’s fantastic book "Beyond Software Architecture".
Tool 1: Change your timescale
The first thing to adjust in breaking the conflict between prediction and emergence is to change our standard column headers so that the first column represents a shorter time period, with the columns to the right representing larger quantities of time in the same amount of space.
Longer timescales for columns that are further into the future
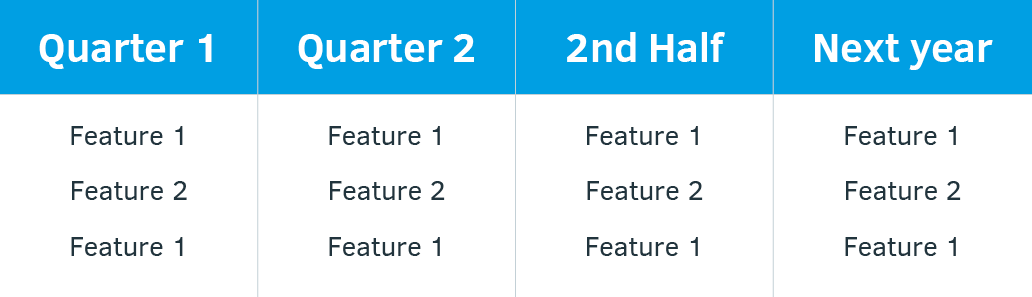
This illustration above shows how a two-year product roadmap might be divided into two quarters, a half year, and a full year. Notice, though, that the width of the column doesn’t double as the timeframe doubles. This visualization implies less detail the further out you go. Those features that aren’t coming for a year out – they’re going to be pretty high level, big ideas, without a lot of detail because there isn’t enough space to add the detail. It communicates more certainty for things that are sooner and less for things that are further out.
You can choose the timeframe that makes most sense for your context. If your context is one of high uncertainty, you could use columns for the next sprint or two, the month or two after that, then a quarter or two following. Maybe you have a lot more certainty in your product, and the timescales can be longer. The key move is to provide less detail further out on the roadmap, so don’t just double the amount of text in each column.
Tool 2: Use multiple lanes
The next tool shifts the product roadmap from visualizing only the “what” of what we’ll build and when, to adding the context for “why.” We can add multiple lanes to the product roadmap to explain our current thinking about why we are doing what we’re doing, and particularly why that results in features or benefits being delivered when they are. There are many factors that might be useful to visualize in this way, so we’ll illustrate the ones that we see most commonly.
Target Market Lane
You’re not building products in a vacuum, you’re building them to meet the needs of your customers. Doing that strategically is an important factor that guides how you prioritize things. Adding a lane to describe which groups of customers are your current focus helps clarify why you’re picking some features now and others later. For the remainder of the article, we’ll take a real example of a SaaS company that launched their offering focusing on individual subscriptions, then was planning to add capabilities that make the offering more enticing for enterprise customers, who have different pains, gains, and jobs to be done from individual subscribers.
Longer timescales for columns that are further into the future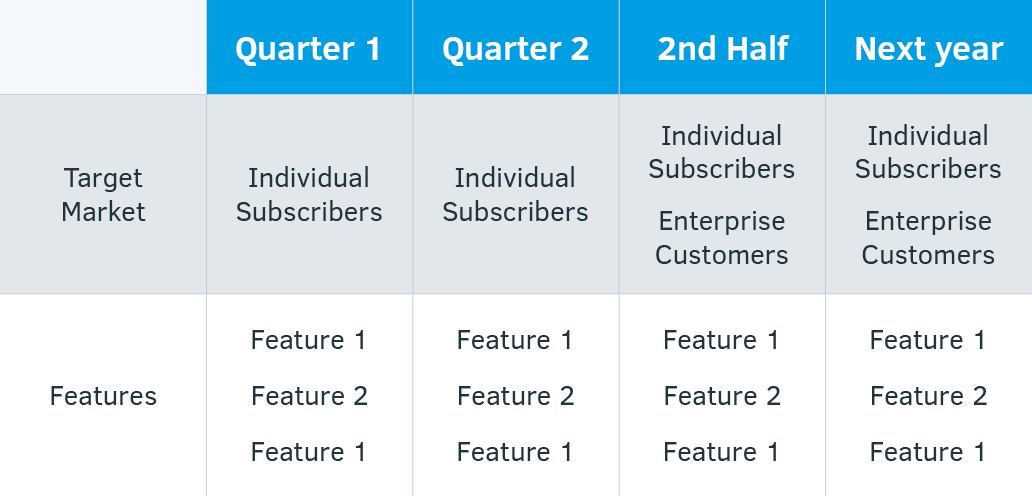
In this illustration, we put the target market lane above the feature lane to illustrate that it is guiding decisions about the features themselves. The features are chosen because of the strategic choice around target markets.
Related webinar: Identifying Customer-Stakeholder Requirements
Technical Dependencies Lane
While agile teams attempt to minimize dependencies, sometimes they make sense. Let’s extend the SaaS product example above, and imagine that one of the features that enterprise customers want for their product is the ability to integrate with their existing enterprise Single Sign-On (SSO) systems. Individual subscribers don’t care too much about this, but for enterprise customers it is critical to manage subscription access within their existing identity management system, SSO. While the SaaS company could choose to build out all of the technology needed to do SSO well, there are 3rd party vendors that already do this well, and the SaaS company decides to focus on their core competencies and “hire out” the core competency of keeping SSO working with all of the common systems. The vendor they choose informs them that it will take a month for them to install the needed components and get them all working in the SaaS company’s environment, so they visualize that as follows:
Adding the Technical Dependencies lane to clarify timing decisions
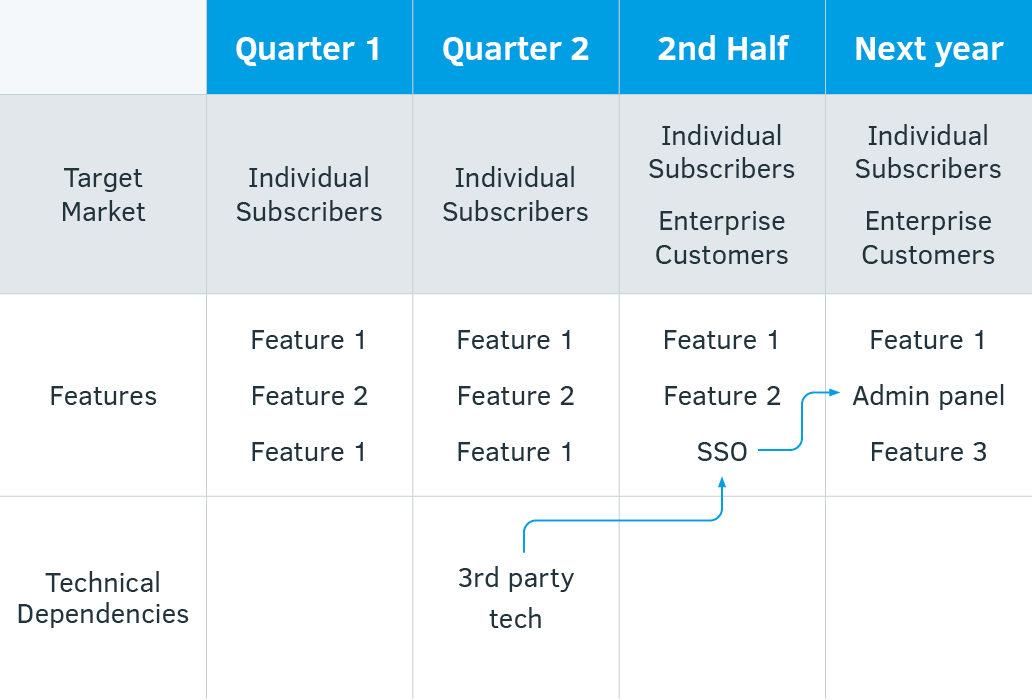
By drawing an arrow between the 3rd party technical dependency and the feature that they’ll deliver to that new target market, the “why” of the timing starts to become clearer to anyone reading the product roadmap. The roadmap is telling a story now, with just enough detail to explain important decisions about what is happening and why.
Market Windows Lane
When is the ideal time to announce and release a new version of a product or service? If you’re selling gingerbread houses in the U.S. market, it’s probably not on Dec. 29. If you are selling a fantasy sports product, it’s probably not halfway into the season. Even if there aren’t strong seasonal influences in your market, there may be trade shows or other industry events that make it an ideal time to have something new and exciting to talk about. There are probably other times that it would be a terrible time to release. For example, many e-commerce platforms lockdown all changes during busy holiday shopping periods to reduce risk.
Adding a lane to visualize market windows helps product owners explain the logic of a chosen release date.
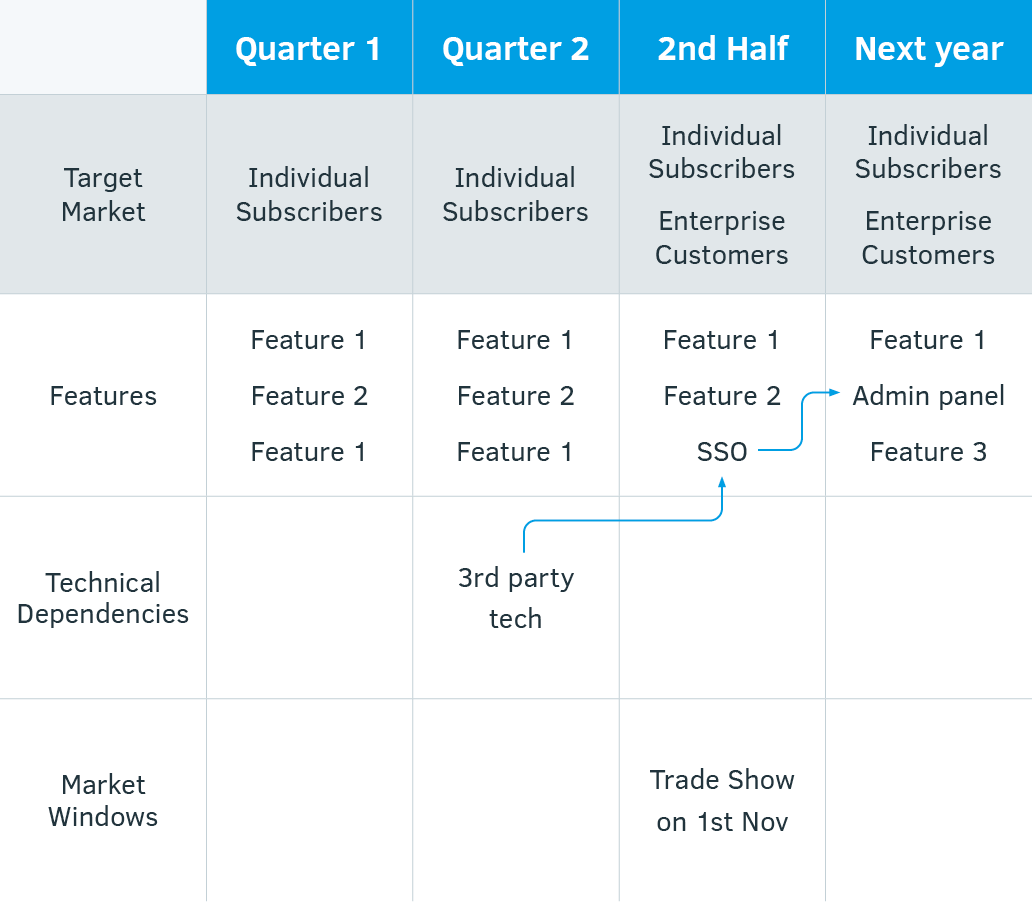
Tool 3: Add graphic components
Finally, we can enhance the visualization of all of these components by turning the text into graphics as illustrated below:

We add three key graphic components to help enhance the visualization of the product roadmap: shape, color, and connectors.
Shape
In the example above, we’ve added shapes for each element of the product roadmap. In the Target Market lane, we’ve visualized how we split the target market from just Individual Subscribers to add Enterprise Customers.
In the Features lane, the length of the rectangles gives a rough forecast of the time needed to develop each feature. For the “Admin Panel” feature, which has some uncertainty (how many components do enterprise customers need to address their most important customer jobs here?), we indicate that the feature has some variability in how long it will take by using the slanted line at the end.
In the Technical Dependencies lane, we use a different tool to indicate even greater uncertainty. In the SaaS example, the company knows that there are rumors of a new hardware option for their servers that will significantly reduce costs. However, they are uncertain exactly when the hardware vendor will release the new capability, nor how long it will take the team to update their software to work effectively on the new platform. This is visualized by using some arrows to indicate our current best and latest guess that it will likely come sometime towards the end of the year and that implementation may span into the next year.
Color
In the Features lane, different teams working on different product backlogs are indicated with two different colors. Each lane also gets its own color to clearly indicate the difference.
Connectors
Since there is a key dependency chain from adding the 3rd party vendor technology, building our SSO connection on that tech stack, building the Admin Panel to take advantage of that capability (which will cause Enterprise Customers to now be excited by our offering), we indicate that using connectors. Additionally, since there is a trade show that would be an ideal market window to release the new capabilities, we create a visual line of sight from the Market Windows trade show event.
Conclusion
Providing the right level of detail by using different time scales, adding lanes for important factors, and visualizing the connection between the information in the road map using graphic elements allows a product owner to balance the organizational need for some certainty with the reality of the emergent nature of product development.
======
Learn more tips for creating an agile product roadmap here.