


Sprint burndown charts claim to help scrum teams keep on track and meet their goal by showing the remaining work compared to the number of estimated task hours. But are they really helpful? Experts aren’t convinced.
The World’s Smallest Online Bookstore (WSOBS) is a fictional company that offers curated choices to buyers, and we will use its scrum team to demonstrate…
Situation
It’s six sprints after the “Overtime/Disastrous Release” that set the WSOBS scrum team back by several months. The pressure to deliver more features continues to grow.
During sprint planning, the team committed to a sprint goal of “Gift cards can be purchased and redeemed.” Reviewing the prioritized product backlog and the estimated items, the team forecasts that they can complete nine user stories towards that goal in this sprint:
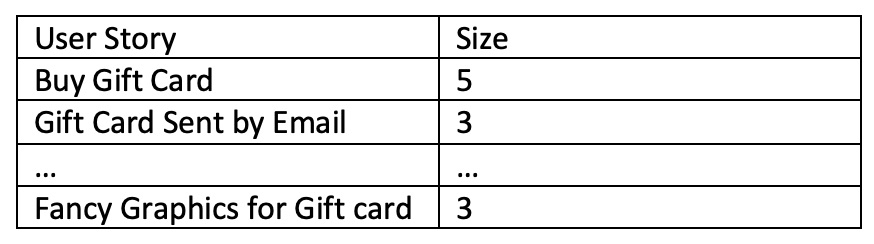
The stories have estimates (sized 1, 2, 3 with one 5), are reasonably well split, and have initial acceptance criteria. Their total of 24 story points seems achievable based on the team’s current average velocity of 22 story points completed per sprint. They have broken the stories down into tasks with a total of 323 estimated task hours, which is also reasonable for a two-week sprint and a team of six people. So they should be all set, right?
Day by day during daily scrum, the team updates the number of estimated task hours of work team members currently agree are remaining in the sprint. This table shows that progress:

In the corresponding burndown chart below, it looks like the team is on track to meet its sprint goal. Or is it?
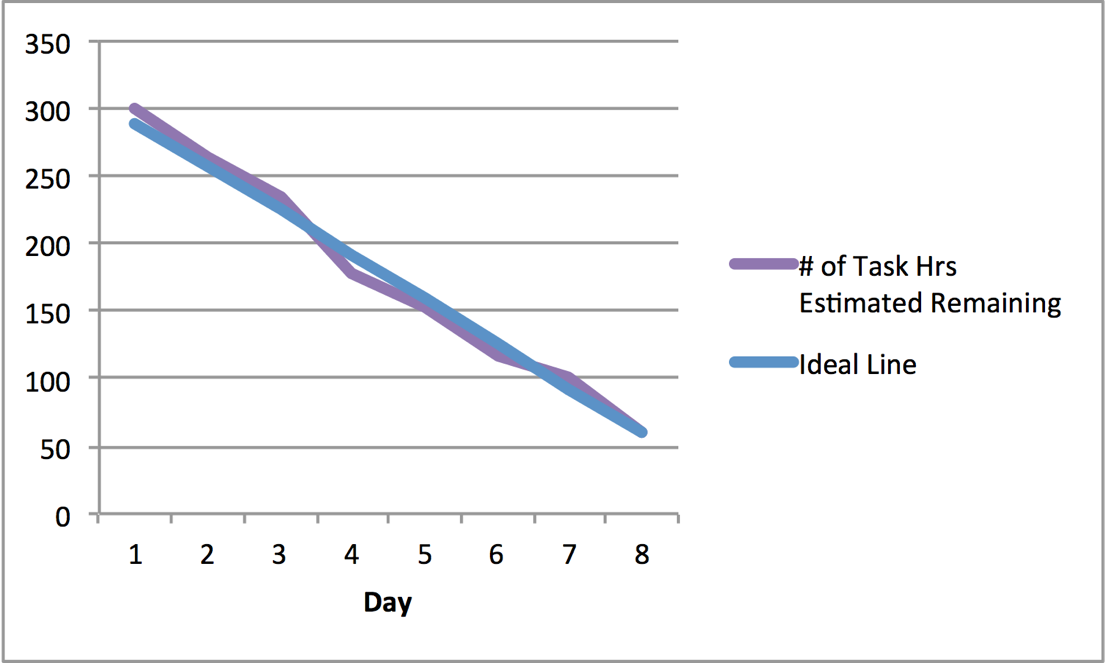
Every day during the sprint, Steve (the scrum master) asks the team, “Are we still on track to achieve our sprint goal?” The team answers, “Yes.”
On Day eight, with only two working days remaining in the two-week sprint, Steve asks his daily question and, all of a sudden, the answer is, "No."
Yikes! How? Why? Everything was looking so good, according to the chart!
The team has approximately 60 hours of work left, four completed stories, and five in progress. Steve asks, “Which stories can we realistically complete?” The team convenes a meeting with product owner Paula to discuss how to handle this. They pick two user stories to focus on and drop the remaining three.
Six of the original user stories will get completed. That’s really not so bad, is it?
Analysis
Is it really that bad? Yes!
A team that doesn’t regularly meet its forecasts will lose the faith of its product owner, and the business as a whole. When the team’s forecast in sprint planning doesn’t mean anything, then team members won’t be focused on getting to the goal. Along the way, predictability goes right out the window.
How did this happen? The team used a sprint burndown chart. It was supposed to keep everyone on track.
The value of tracking depends on what you track.
The sprint burndown tracked estimated hours of work remaining to get people to focus on a perceived “ideal” line (properly called a “rhumb” line). People tend to focus on the rhumb line because that’s what they think management wants. They pay attention to it even when it isn’t drawn because we assume the natural path to "done" follows that line. In reality, sprint work rarely does.
During the daily scrum, some teams update the burndown chart to indicate the number of hours of work remaining on a task. It’s not uncommon for them to do so by reducing it by the amount of time they worked on it, not by the amount they honestly think remains. After all, it’s embarrassing to admit that you just spent six hours on a task, but the number of hours remaining has only been reduced by two. As a result, the discovery of problems is significantly delayed since the chart shows a distorted view.
This happens because we don’t like to think about the work that still remains, rather we prefer to record what we’ve done.
It’s human nature to focus on what is being tracked. A sprint burndown chart puts the spotlight on delivering task hours, rather than value to the customer (i.e. sprint goal and product backlog items).
Consider these two teams on day eight of a two-week sprint. Assume the team worked on the same stories for the same sprint. Team B paid attention to sprint burndown and Team A focused on delivering value.

Clearly, Team A is better off, even though it has more task hours remaining. It focused on getting it user stories to complete. With Team B, even though its burndown chart would look closer to the ideal line, we’ve no idea what will really get done. In the real world, some of Team B’s stories will probably bottleneck on testing and not get completed, since it has so many items in progress at once.
Alternatives
To find something that works better to help your team, here are some experiments you can consider running. Some of these will take longer to pay off than others.
-
Measure your sprint burndown in number of user stories or story points. Only update the chart when a story is completed. This moves the focus from tasks to completed stories.
-
Dispense with story point estimation. Instead, slice all PBIs/user stories to approximately the same size. A large variance in the user story size indicates that items take anywhere from very little time to a very long time, and this vagueness harms predictability. If you’re going to estimate, reduce the variance. A range of one to five is large enough.
-
Eliminate estimation of task hours because there is rarely any correlation between what’s estimated and the time actually taken. Instead, during sprint planning, just ask whether all the tasks are smaller than a day. This moves the focus away from tracking task hours to finishing tasks. Some teams have stories that are large enough that they benefit from subtasks.
-
Limit work in progress (WIP). This forces the team to finish user stories, collaborate, and share knowledge. As demonstrated in “The Impact of Agile Quantified” Rally research study, reducing WIP also gets more stories done with fewer defects found in production.
-
Choose a clear and effective sprint goal. In this example, a good sprint goal might have been: “By the end of the sprint the Basic Gift Card should be available.” The sprint goal allows team members to ensure their work is driving toward a greater goal. It helps maintain focus more effectively than a random grab bag of stories. If something needs to be dropped, it gives greater clarity around that choice.
-
Use pair programming, in which two people write code together on one machine. This helps the sprint progress by shifting the focus to completing stories and limiting the WIP. There are many other benefits to pair programming, however, it would take a whole new article to cover them.
-
Consider ensemble programming, the logical extension of pair programming. If the entire team is focused on one story at a time, then it is truly limiting WIP. Teams that do this tend to have higher throughput because of better quality.
-
Try using behaviour-driven development (BDD). Team members collaborate on describing the behaviours of the user story they’re attempting to build, with a series of examples written in a language that users would be able to understand. This improves the focus on delivering value (over tasks), and also naturally limits WIP.
-
Dispense with sprint burndowns altogether and just focus on the flow of work across the scrum wall. This is frequently an effective pattern, especially with mature teams. This isn’t difficult to implement, it just takes a mature team that has learned to look at their sprint backlog as a picture of their day-to-day team health.
Like Brutus, I come not to praise sprint burndown charts, I come to end them. As I have shown, burndown charts are a relic of a bygone scrum age. Please use some of the techniques above. They will improve your team’s predictability (the original purpose of burndowns) and their throughput.
Read more stories about the world’s unluckiest scrum team at Scrum by Example. For more complete definitions and resources for BDD, ensemble programming, or pair programming, visit the Agile Glossary and Reference Library.
About the Author

Mark Levison is a Certified Scrum Trainer and principal Agile Coach of Agile Pain Relief Consulting. With over 30 years of experience in the IT industry, he has been learning and teaching agile since 2001. Introducing scrum, lean, and agile methods to many organizations — from government departments and banks to healthcare and software companies — Levinson has coached thousands of professionals throughout Canada.
------
- A reminder that user stories will often be useful, but are not part of scrum.
- Story points: Many in the agile community, including the people who created them (Ron Jeffries and Chet Hendrickson) have abandoned their use.
- Hint: Again even the people who invented story points have moved on.